Mapping the Extent of Invasive Phragmites australis subsp. australis From Airborne Hyperspectral Imagery
 Kathryn Elmer
 Margaret Kalacska
 J. Pablo Arroyo-Mora
- 1Applied Remote Sensing Lab, Department of Geography, McGill University, Montreal, QC, Canada
- 2Flight Research Lab, National Research Council of Canada, Ottawa, ON, Canada
Invasive species pose one of the greatest threats to global biodiversity. Early detection of invasive species is critical in order to prevent or manage their spread before they exceed the ability of land management groups to control them. Optical remote sensing has been established as a useful technology for the early detection and mapping of invasive vegetation populations. Through the use of airborne hyperspectral imagery (HSI), this study establishes a target detection methodology used to identify and map the invasive reed Phragmites australis subsp. australis within the entire extent of Îles-de-Boucherville National Park (Quebec, ON, Canada). We applied the Spectral Angle Mapper (SAM) target detection algorithm trained with a high accuracy GNSS ground truth data set to produce a park-wide map illustrating the extent of detected Phragmites. The total coverage of detected Phragmites was 26.74 ha (0.267 km2), which represents 3.28% of the total park area of 814 ha (8.14 km2). The inherent spatial uncertainty of the airborne HSI (∼2.25 m) was accounted for with uncertainty buffers, which, when included in the measurement of detected Phragmites, lead to a total area of 59.17 ha (0.591 km2), or 7.26% of the park. The overall accuracy of the Phragmites map was 84.28%, with a sensitivity of 76.32% and a specificity of 91.57%. Additionally, visual interpretation of the validation ground truth dataset was performed by 10 individuals, in order to compare their performance to that of the target detection algorithm. The overall accuracy of the visual interpretation was lower than the target detection (i.e., 69.18%, with a sensitivity of 59.21% and a specificity of 78.31%). Overall, this study is one of the first to utilize airborne HSI and target detection to map the extent of Phragmites over a moderately large extent. The uses and limitations of such an approach are established, and the methodology described here in detail could be adapted for future remote sensing studies of Phragmites or other vegetation species, native or invasive, at study sites around the world.
Introduction
Second only to habitat loss, invasive species are one of the most significant threats to global biodiversity (Early et al., 2016; IUCN, 2017; Mack et al., 2000; U.S. Congress Office of Technology Assessment, 1993), and can adversely affect the structure and function of the ecosystems to which they are introduced (Mack et al., 2000). Additionally, invasive species and their management come at a high economic cost (e.g., an estimated $120 billion per year in the United States) (Leung et al., 2002; Pimentel et al., 2005), can create human health problems in nearby populations (e.g., increased source of allergens, biological invasions of disease-carrying insects such as mosquitos) (Soulé, 1992) and can negatively impact the recreational enjoyment of natural areas (Canadian Food Inspection Agency, 2008; Pejchar and Mooney, 2009). Given the detrimental impact of invasive species observed in various ecosystems (He et al., 2011), concerns surrounding invasive species have spurred an increase in research that covers a broad range of topics, including understanding mechanisms of invasion and determining the proper information needed to create management plans for specific invasive species (Hastings et al., 2006; Belzile et al., 2010). However, extensive field campaigns to identify, map, and track the spread of invasive species are not always practical or cost effective, making it difficult to monitor invasive species over vast areas. Geographic Information Systems (GIS) and airborne and satellite based remote sensing can produce critical information to help land managers establish appropriate management plans (Shaw, 2005), react rapidly to detect and respond to an early invasive before a species becomes established (Westbrooks, 2004), or forecast the potential spread of invasive species to susceptible areas (Rocchini et al., 2015). Furthermore, remote sensing also provides a powerful way to identify and map invasive species over different spatial and temporal scales while simultaneously building a strong understanding of key physical characteristics of invasive species (C.-y. Huang and Asner, 2009; Underwood et al., 2007).
The utility of multi- and hyperspectral imagery for mapping invasive species have been clearly shown in the literature. Morisette et al. (2006) combined MODIS imagery and thousands of field sampling points through logistic regression in order to generate a habitat suitability map for invasive tamarisk (Tamarix spp, salt cedar) for the entire continental United States. The resulting map had an overall accuracy of 90%, and indicated varying levels of risk for habitat that could be susceptible to invasion by tamarisk. Asner et al. (2008a) relied upon airborne hyperspectral imagery in order to identify 12 highly invasive species in subtropical forests in Hawai’i, based on subtle differences found in the invasive tree species’ spectral signatures. Importantly, no one spectral region consistently best defined the separability of the different species, leading to the use of the full spectrum in their study. Moreover, Lass et al. (2005) also utilized hyperspectral imagery at various spatial and spectral resolutions in order to identify locations of invasive Centaurea maculosa (spotted knapweed) and Gypsophila paniculata (babysbreath) in the United States. Using ground validation of the classified imagery, they were able to correctly identify 57% of known spotted knapweed infestations and 97% of known babysbreath infestations. Skowronek et al. (2017) combined airborne hyperspectral imagery with field data in order to generate a distribution map of the invasive bryophyte Campylopus introflexus (heath star moss) in northern Germany. Importantly, they created a species distribution map with an overall accuracy of 75%, despite the small and inconspicuous nature of the moss. While previous studies, such as those described above, have successfully used remotely sensed data to locate and map the extent of invasive species, critical baseline data is still needed for many problematic invasive species in many regions of the world (Große-Stoltenberg et al., 2016).
The invasive grass species P. australis subsp. australis (hereafter Phragmites), also recognized as P. australis (Cav.) Trin. Ex. Steudel and known as the common reed, has become one of the most aggressive invasive plant species in eastern North America. Phragmites can be found throughout all states in the contiguous United States, and in the southern portions of six Canadian provinces (Saltonstall et al., 2004). Due to its ability to survive under a wide range of conditions, this reed can be found in a variety of habitats, including dry or wet soil conditions, and freshwater or brackish aquatic habitats (Chambers et al., 1999; Sturtevant et al., 2019). Recently, Phragmites has spread prolifically along the Saint Lawrence River, throughout the Great Lakes region, and along major highway systems, which serve as major transport corridors in North America and facilitate substantial inland spreading (Hudon et al., 2005; Lelong et al., 2007; Tulbure et al., 2007; Jodoin et al., 2008). Given its prolific and hardy nature, it is important that land managers be able to locate stands of Phragmites, both while they are still relatively small as well as larger established stands, in order to control, eradicate, or prevent the spread of new or existing stands. Studies related to the remote sensing of Phragmites have predominantly relied upon imagery from various spaceborne sensors. For instance, Pengra et al. (2007) utilized EO-1 Hyperion imagery in order to map Phragmites in Wisconsin, United States. They were able to achieve 81.4% overall accuracy, however they noted the difficulty in identifying Phragmites stands due to the limitations of the sensor’s spatial resolution of 30 m. A study by Poulin et al. (2010) used multi-season remotely sensed imagery of Phragmites collected by SPOT-5 over the Rhone delta in southern France. Water and vegetation measurements were collected over 2 years in order to form a multi-temporal dataset to assist with modelling different aspects of reed structure such as stand height, density, and coverage. While these initial studies show promising results in the ability of remotely sensed data to accurately identify and map Phragmites, the use of airborne hyperspectral imagery has not been explored.
The objective of this study was to estimate the extent of Phragmites coverage within Îles-de-Boucherville National Park (Quebec, Canada) from airborne hyperspectral imagery utilizing a target detection methodology. Target detection algorithms can be advantageous over conventional classification, as they do not require precise knowledge of every endmember present in the scene in order to locate a specific target material. Target detection has been commonly applied for military applications [e.g., Yuen and Richardson (2010)], oil spill detection [e.g., Alam and Sidike (2012)] and geological studies [e.g., Dos Reis Salles et al. (2017); Molan et al. (2014)], among others. Target detection can also be used for vegetation studies, such as those concerned with identifying a specific species of interest. For example, Lass et al. (2005) exploited the spectral angle to create maps of the extent of two invasive species of interest, spotted knapweed and babysbreath (discussed above). However, many remote sensing studies of vegetation and invasive species still rely on conventional classification methods (Joshi et al., 2004), so the utility of target detection algorithms for invasive vegetation detection remains to be established. Our resulting Phragmites extent map provides the park management team with a tool to assist with their ongoing efforts to manage and eradicate populations of Phragmites at various locations within the park. While our focus is on detecting and mapping Phragmites at Îles-de-Boucherville, the general methodological approach applied here, can be implemented in other locations where Phragmites species can be found and to other invasive terrestrial vegetation species worldwide.
Materials and Methods
Study Site
The study was carried out in Îles-de-Boucherville National Park (Quebec, Canada), which covers an area of approximately 8.14 km2 and consists of five islands in the Saint Lawrence River between the Island of Montreal and the municipality of Boucherville (Figure 1) (Laliberté et al., 2006). The area has experienced a long history of heavy agricultural use, beginning with the arrival of the first settlers towards the end of the 17th century (Giroux, 1986) and continuing into modern times with the presence of privately-owned agricultural areas on Île de la Commune and Île Grosbois.
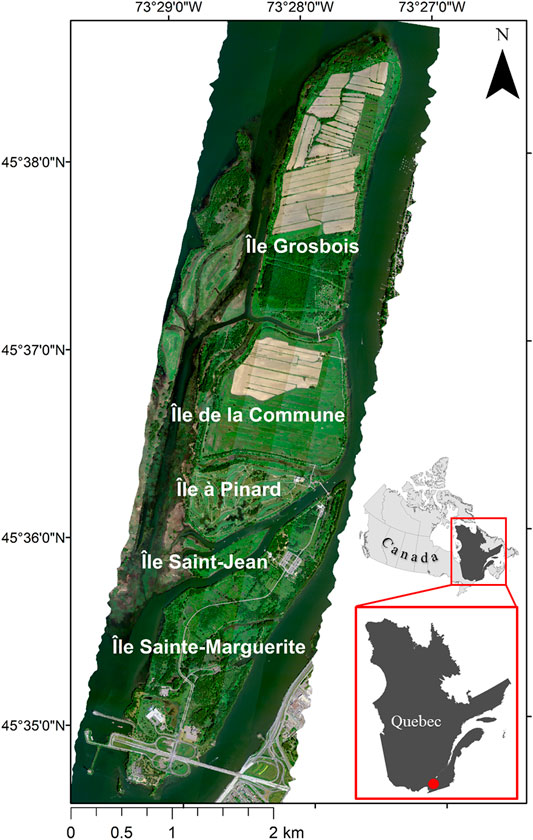
FIGURE 1. The extent of Îles-de-Boucherville National Park, which consists of five main islands in the Saint Lawrence River. Basemap imagery is the mosaic of the five CASI-1500 flight lines acquired on July 08, 2019, displayed using RGB bands 648, 550, and 430 nm. Projection: WAGS84/UTM Zone 18N (EPSG: 32618). The subset in the bottom right corner shows the position of the park (red circle) within the province of Quebec, Canada.
Îles-de-Boucherville National Park was officially created in 1984, when the Quebec Ministry of Forests, Wildlife and Parks designated the islands a protected area, which led to the subsequent abandonment of multiple agricultural fields. Herbaceous and shrub vegetation soon became the dominant land cover type within the park. More than 450 plant species are present, across both terrestrial and aquatic ecosystems (Société des établissements de plein air du Québec, 2020). Commonly found species include Cornus sericea (red osier dogwood), Asclepias syriaca (common milkweed), Solidago gigantea (giant goldenrod), and Phalaris arundinacea (reed canary grass). Young forested areas are scattered throughout the park, mainly comprised of Populus deltoides (eastern cottonwood) and Fraxinus pennsylvanica (green ash). Approximately 18 ha of established mature forest (∼70–90 years old) is located on Île Grosbois, and is the only mature forest within the park (Ross, 1990; Laliberté et al., 2006).
Commonly found throughout the park, in both terrestrial and aquatic ecosystems, is the invasive common reed P. australis subsp. australis (Figure 2). Extensive stands of this invasive reed can be found in open fields, along hiking trails, in former agricultural ditches, along riverbanks and in river channels: one of the largest stands of Phragmites in the province of Quebec is located along the western edge of the park boundary in the Courant Channel (Hudon et al., 2005). Controlling Phragmites as part of the restoration of former agricultural fields back to natural habitat is a priority issue in the 2017–2022 Îles-de-Boucherville National Park Conservation Plan, set forth by the Société des établissements de plein air du Québec (SEPAQ) (Société des établissements de plein air du Québec, 2020).
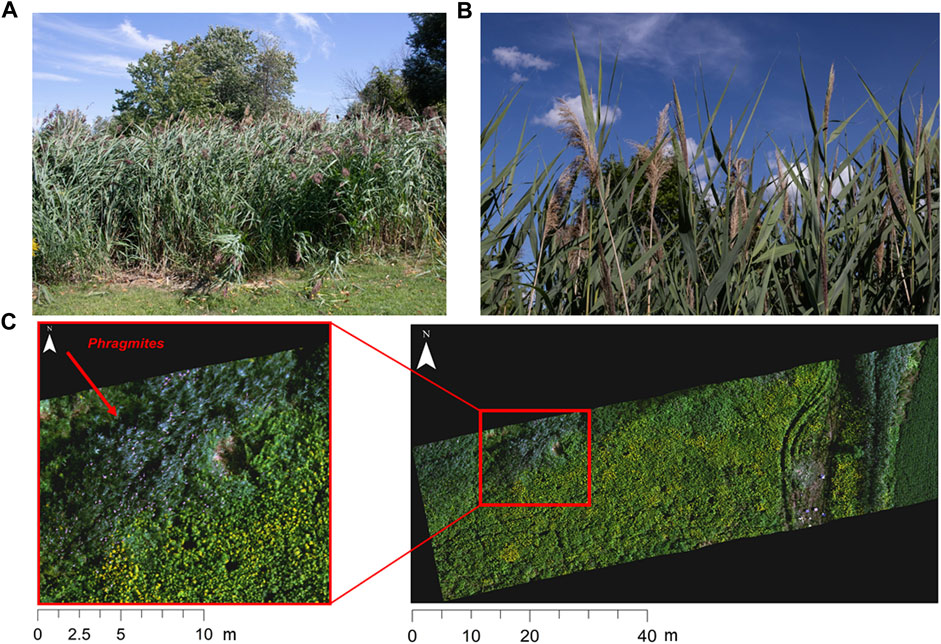
FIGURE 2. (A) A dense monotypic stand of Phragmites australis subsp. australis found within Îles-de-Boucherville National Park. (B) An example of the brown Phragmites seed heads. (C) Overhead view of a Phragmites stand and subset showing the contrast with the surrounding vegetation. uCASI hyperspectral image from an RPAS platform is shown in RBG bands 637, 550, and 430 nm.
Description of P. australis subsp. Australis
Phragmites demonstrates an affinity for disturbed ecosystems such as former agricultural fields or wetland environments, particularly those that have been enriched with nutrients such as nitrogen due to agricultural or other anthropogenic sources (Belzile et al., 2010). Methods of spread include seed dispersion or by the transport of rhizome fragments to new areas, either via environmental mechanisms (e.g., wind and wave action) or via anthropogenic means. The plant is characterized by long, flat, green leaves that grow from a hollow stem. A bushy panicle, or seed head, will develop in late summer and will persist into winter after the seeds have been released. This seed head is distinct, and can vary in color depending on its maturity: common colors include brown/tan or deep purple (Figure 2). Phragmites is considered an indicator of ecosystem disturbance due to its aggressive nature and tendency to grow in dense monotypic stands up to 3 m tall that consist of an extensive network of stolons and rhizomes. These dense stands can prevent the growth of other surrounding vegetation, or even outcompete existing vegetation, effectively reducing plant biodiversity in the area (Saltonstall, 2002). This loss of species richness and the associated potential loss of biodiversity or extinction is one of the primary concerns regarding Phragmites (Chambers et al., 1999; Cronk and Fuller, 2001). These characteristics and tendencies of Phragmites make removal of established stands difficult, especially once it has grown over an extensive area. Efforts to manage and eradicate established populations of Phragmites can be difficult and typically require extensive physical labor and considerable investments of time and money (Martin and Blossey, 2013). There are several chemical options for controlling Phragmites, such as broad-spectrum herbicides that have documented effectiveness (Avers et al., 2007). However, these chemicals are non-selective and could damage native species, and are not always permitted in certain areas such as wetlands. Mechanical methods of control (e.g., hand cutting or mowing) can be effective in the short term, but are less likely to be successful in the long term without combining them with other control methods such as herbicides or controlled burning (Getsinger et al., 2006; Avers et al., 2007). Mechanical methods also risk transferring rhizome fragments or seeds, which could cause new invasions.
Overview of Data and Methods
Here we present an overview of the methodology conducted for this research, as shown in the flowchart in Figure 3. These steps are discussed at length in the following sections.
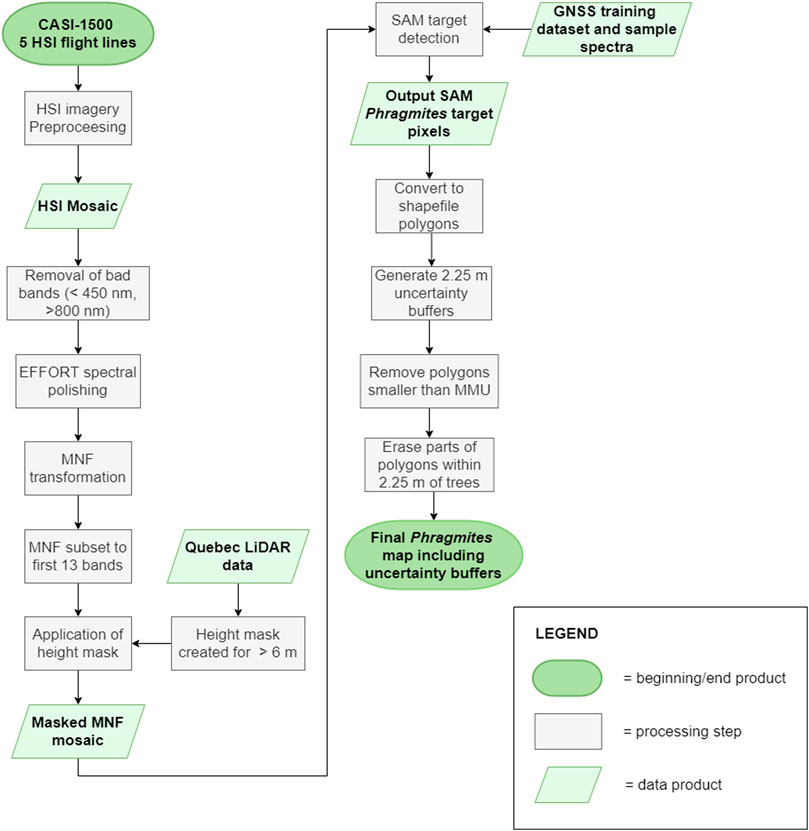
FIGURE 3. A detailed flowchart showing the airborne HSI and target detection methodology steps used to generate the final map of Phragmites including the error buffers.
Ground Truth Data Collection and Training/Validation Datasets
A total of 319 ground truth points were collected across the extent of Îles-de-Boucherville National Park to provide a high-accuracy dataset (<1 m spatial error) for training and validation of the target detection algorithm. A detailed description of the methodology used to collect the points, as well as the accuracy assessment and available data products are described in Elmer and Kalacska (2021). The ground truth points were randomly separated into 160 points for training the target detection algorithm and 159 points for validating the accuracy of the algorithm’s output. The training set consisted of 79 points with no Phragmites present and 81 points where Phragmites was present, while the validation set consisted of 83 points with no Phragmites present and 76 points where Phragmites was present. The ground truth points were split evenly in this way to avoid creating a bias in the training/validation sets. Additionally, each set of ground truth points represented a fairly equal geographic spread of points across the park extent. This was an important consideration because the park is not uniform in ground cover: the upper portion of the park is dominated by agricultural fields, while the lower portion of the park is characterized by natural fields and areas of shrubby vegetation.
The training set of 160 points was used as the basis for creating the samples of target spectra that served as input for the target detection algorithm. In order to increase the number of target spectra for better comparison during the target detection analysis, the 160 training points were expanded to include nearby pixels that fell within the appropriate land cover types. For the target spectra, samples were taken from measured Phragmites stands. Non-target spectra were also collected to provide examples of spectra to reject during target detection: this included water, agricultural fields characterized by dry soil and dried out vegetation, asphalt roads, and other vegetation that was not Phragmites.
Airborne Hyperspectral Imagery (HSI)
Airborne hyperspectral imagery (HSI) was acquired on July 08, 2019 as part of the Canadian Airborne Biodiversity Observatory project (Arroyo-Mora et al., 2019) and consisted of five flight lines collected over the extent of Îles-de-Boucherville National Park (Table 1). The aircraft used as the sensor platform was a DeHaviland Twin Otter owned and operated by the National Research Council of Canada’s Flight Research Laboratory (NRC-FRL, Ottawa, ON, Canada). The hyperspectral sensor used to acquire the imagery was a Compact Airborne Spectrographic Imager 1500 (CASI-1500, hereafter CASI) (ITRES Ltd., Calgary, AB, Canada). The CASI collects up to 288 spectral bands between 375 and 1,054 nm, with a field of view of 39.9° and 1,498 across-track pixels.
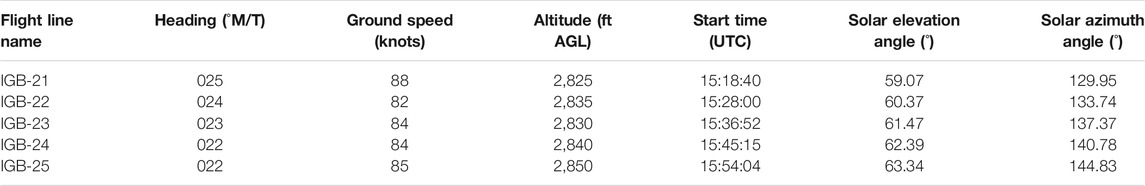
TABLE 1. Details of the five CASI-1500 flight lines acquired over Îles-de-Boucherville National Park on July 8, 2019.
The five individual CASI flight lines underwent pre-processing using software modules developed by the sensor’s manufacturer before they were used for analysis, as described by Soffer et al. (2019). First, a calibration was made to account for the effects of temperature and pressure shifts in the internal sensor alignment. Next, a spectroradiometric calibration was performed that removed the estimated signal offsets inherent in the recorded digital values from various sources (dark current, electronic offset, internal scattered light, second order scattered light, and frame shift smear) and converted the data to units of spectral radiance (uW cm−2 sr−1 nm−1). The flight lines were then atmospherically corrected using ATCOR-4 (Richter and Schläpfer, 2011). Finally, the flight lines were geometrically corrected (2 m resampled pixel size) and mosaicked such that pixels with a viewing angle closest to nadir were prioritized and preserved in the areas of overlap between the flight lines (Figure 1). The reported positional accuracy of the HSI is an average error of 0.91 in easting and 0.67 m in northing (Elmer and Kalacska, 2021).
The HSI mosaic was spectrally subset to remove bands with low signal level and high levels of noise due to residual atmospheric absorption features: these consisted of wavelengths below 450 and greater than 800 nm, respectively. The mosaic then underwent spectral polishing to remove high frequency noise using the Empirical Flat Field Optimal Reflectance Transformation (EFFORT) polishing tool (Boardman, 1998, December). One of the challenges of HSI is its large dimensionality and high correlation between bands, which can make target detection more time consuming and the results less accurate if all bands are used (Ready and Wintz, 1973; Landgrebe, 2002). In order to reduce the dimensionality of the data and isolate the signal from noise, the spectrally subset and polished mosaic underwent a Minimum Noise Fraction (MNF) transformation (Green et al., 1988). The output eigenvalues indicated the approximate number of bands that contained meaningful information, and visual assessment of these bands for spatial coherence determined that the first 13 MNF bands contained the majority of the relevant signal. The output MNF image was subset to these first 13 bands, which became the input image for target detection.
Many remote sensing applications assume that the contribution to a pixel’s signal is uniform across the given pixel size for the data product (i.e., a pixel with a 2 m × 2 m spatial resolution contains only the signal(s) from the materials that fall within the pixel’s footprint). In reality, this assumption is not true and the contribution of materials to each pixel is spatially non-uniform according to its net point spread function (PSF) (C. Huang et al., 2002). For example, the imagery acquired using the CASI for this study has a net PSF that extends approximately 1.88 m in the along-track direction and 1.85 m in the cross-track direction, with a true pixel size of 1.64 m in the across track and 1.63 m in the along track and only 76% of the pixel’s signal originates from materials within the given pixel extent, while the remaining 24% is contributed by materials in neighbouring pixels (Inamdar et al., 2020). Consideration of the specific characteristics of a sensor’s geometry is therefore critical to understanding the actual contributions to a pixel’s spectrum, which has important implications for the analysis and interpretation of data products derived from such sources. This characteristic of the HSI was accounted for during analysis using the methods described in Target Detection Analysis below.
Ancillary Data: Quebec LiDAR Dataset
Open access LiDAR-MCH (mean canopy height) data were used to investigate the height profiles of established Phragmites stands within the study area, and to mask out materials taller than a specified height so that they would not be analyzed as part of the target detection. The LiDAR data was acquired by the Quebec Ministry of Environment, and Fight Against Climate Change, as part of the province-wide collection of open-access LiDAR data (available at https://www.foretouverte.gouv.qc.ca/). The two tiles that covered the area of interest (31H11SO and 31H11NO) were acquired in 2018 with a point density of 4 points/m2. The data are provided as rasterized tiles with a pixel size of 1 m. The LiDAR tiles were mosaicked, clipped to the area of interest, and resampled to a 2 m pixel size (Figure 4).
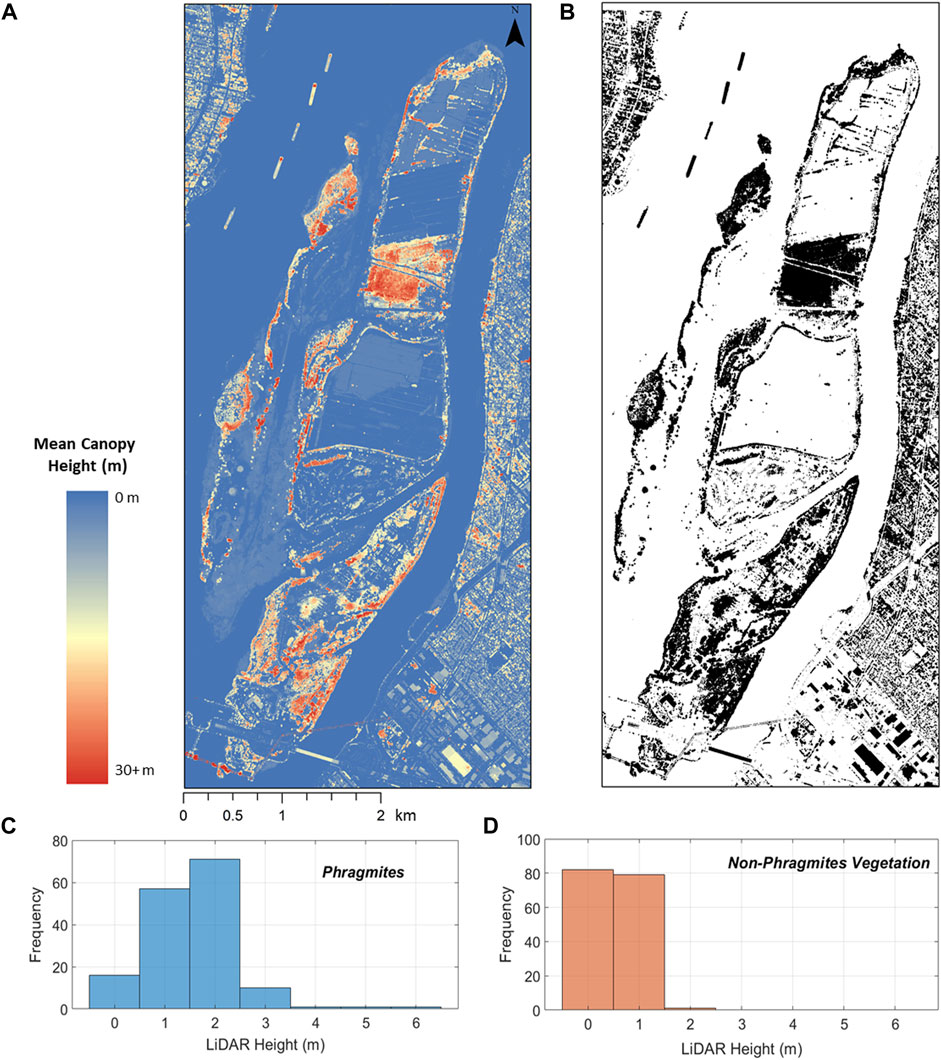
FIGURE 4. (A) The Quebec LiDAR dataset subset to the area containing Îles-de-Boucherville National Park. (B) The resulting height mask, where the black represents areas with a height of greater than 6 m (C) frequency distribution for the relative heights of Phragmites (D) frequency distribution for the relative heights of non-Phragmites vegetation.
Tall, forested areas of the park could be disregarded from the target detection analysis, as any Phragmites covered by tree canopy would not be visible in the HSI and therefore not reliably detectable. However, Phragmites commonly grows up to 6 m in height (Goodrich and Neese, 1986) so in order to avoid inadvertently masking out Phragmites stands on the taller end of the growth profile, the canopy height of 158 Phragmites ground truth points were extracted from the LiDAR-MCH data. The resulting distribution of Phragmites’ heights are shown in Figure 4. As there were no sampled areas of Phragmites taller than 6 m, the threshold for the height mask was set to >6 m.
Target Detection Analysis
The 13 band MNF image was the input for target detection based on the Spectral Angle Mapper (SAM) (Boardman, 1993; Kruse et al., 1993). The Phragmites ground truth points (training subset) were separately provided as sample target spectra. Additionally, the sample spectra of non-target materials (water, fields, roads, and non-Phragmites vegetation) were specified as targets to reject. SAM treats both the reference target (r) and the unknown spectra (t) as vectors in order to calculate the angle in radians between the spectra as a method of determining spectral similarity (Boardman, 1993) (Eq. 1).
where (nb) is the number of bands. The more similar an unknown spectrum is to the reference spectrum, the smaller its angle: if the calculated angle falls within the user-defined angle threshold, the associated spectrum is labeled as the target. The SAM algorithm is insensitive to differences in illumination and albedo as it only uses the vector direction and not the vector length to determine spectral similarity (Kruse et al., 1993). Therefore, it can be particularly useful for scenes that are not acquired under uniform illumination conditions, such as the HSI used here: over the period of acquisition, the solar azimuth angle changed between 129.95 and 144.83° and the solar elevation angle changed between 59.07 and 63.34° (Table 1). These changing illumination conditions can influence the magnitude of the spectral reflectance for vegetation, as reflectance will typically increase with increasing solar zenith angle due to the effects of the bidirectional reflectance distribution function that is unique to each material (Ranson et al., 1986; Gross et al., 1988).
For the Phragmites class, the SAM threshold was set to 0.65 radians. This value was determined by examining the results and selecting the threshold value that resulted in the best coverage of known target areas (i.e., known extensive, homogeneous stands of Phragmites) while minimizing the extent of erroneously identified pixels.
Due to the positional error of the HSI following geocorrection, and the contribution of materials located in neighbouring pixels determined by the net PSF [as described in Airborne Hyperspectral Imagery (HSI)], a buffer with a distance of 2.25 m was determined in order to account for areas of uncertainty. This uncertainty buffer therefore determined the minimum mapping unit (MMU) for the Phragmites map and polygons with an area smaller than 16 m2 (four pixels) were removed. Using the uncertainty buffer, the sections of the target polygons that were within 2.25 m of trees (determined using the LiDAR-MCH > 6 m mask) were removed due to the potential contribution of the spectra of tree components such as leaves, branches, and tree shadows to the neighbouring pixels. The 2.25 m buffer was also applied to each of the target polygons. The Phragmites polygons and their buffers represent the final map of identified Phragmites within Îles-de-Boucherville National Park, as shown in Figure 5.
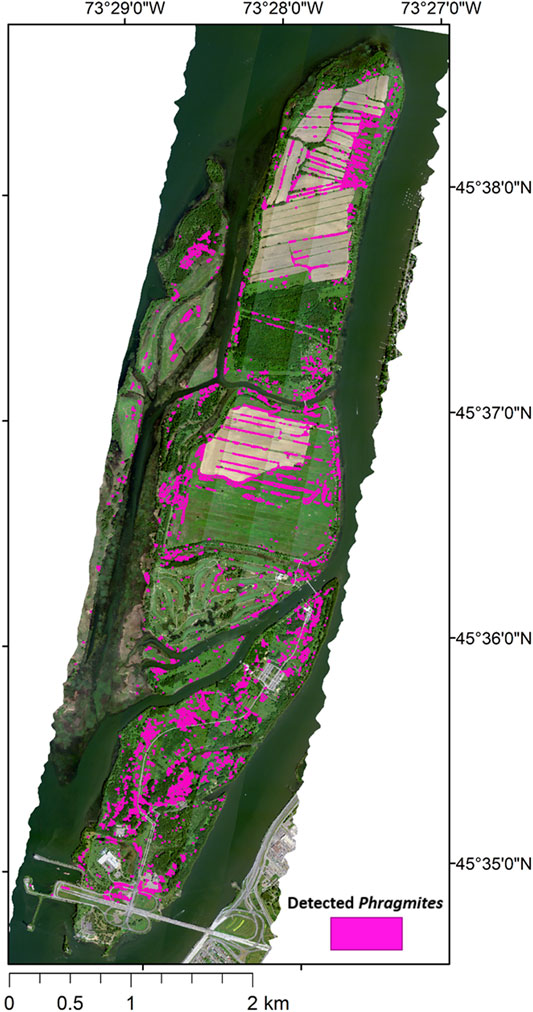
FIGURE 5. The final map of the extent of detected Phragmites within Îles-de-Boucherville National Park overlayed on the HSI mosaic.
Validation of the Phragmites Extent Map
To account for the associated positional error of the validation ground truth points (Elmer and Kalacska, 2021), a 1.75 m error buffer was calculated for each of the 159 points. To carry out the validation, the points were analyzed to determine if their respective error buffers overlapped with the uncertainty buffers associated with the Phragmites polygons.
As a way of comparing the accuracy of the algorithm-based target detection methods to conventional visual interpretation conducted by visual interpreters, an online tool was used in order to determine the ability of the visual interpreters to corrected identify Phragmites from aerial imagery. The “human accuracy” using the same set of validation points was compared to the calculated accuracy of the SAM target detection methodology. Fifteen-meter buffers were drawn around each of the 159 validation ground truth points and displayed on subsets of Satellite Streetview imagery (DMTI Spatial ULC, Richmond Hill, ON, Canada). This imagery consists of pansharpened (60 cm) satellite imagery acquired in 2012. Similar to the Picture Pile tool (https://geo-wiki.org/games/picturepile/) implemented by Danylo et al. (2021), the Satellite Streetview subsets were arranged and displayed online in Survey Legend (Malmö, Sweden) (Figure 6). A total of 10 visual interpreters examined the 159 ground truth points and determined if Phragmites was present within the buffers or not. Each interpreter was first shown several example images of Phragmites and non-Phragmites images and then asked to examine all 159 images, which allowed for direct cross-comparison of each individual image.
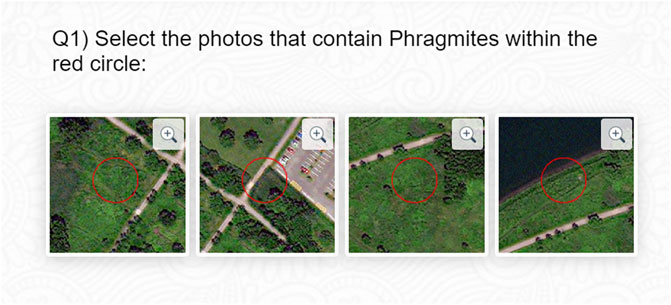
FIGURE 6. An example of one of the visual interpretation questions as it appeared to the interpreters, where each square contained a subset of the high-resolution Satellite DMTI Streetview imagery centered on one of the 159 validation points and the associated 15-m buffer. Interpreters selected photographs that contained Phragmites within the buffer. The interpreters could click on the magnifying glass icon to zoom in for more detail. For this question, the second and fourth images from the left are the correct images that contain Phragmites.
It is important to note that the high-resolution imagery was collected in 2012, while the validation data was collected in 2019. Therefore, there may be some inconsistencies in the appearance of land cover types between the high-resolution Satellite Streetview images and the HSI used for target detection. For example, one validation point was collected in a grassy field in 2019, while in the 2012 imagery it appears as a cultivated agricultural field. Each high-resolution image was examined to ensure that there was no misrepresentation of the validation points to the visual interpreters (i.e., all ground truth points indicating no Phragmites appeared with no Phragmites in the 2012 imagery, and vice versa for the Phragmites points).
Results
Target Detection Results and Accuracy
Investigation of the input spectra used to train the target detection algorithm revealed that the brown Phragmites seed heads present within the stands were spectrally distinct from the leafy green portion of the plant (Figure 7). In order to include this part of the plant in the target detection results, which could be the dominant material present in some Phragmites pixels, additional target spectra were collected from the brown seed heads and used to train the target detection algorithm on this separate class. It was also noted that there were considerable spectral similarities and overlap between the brown seed heads and the agricultural field spectra, which was comprised of dry soil and vegetation: this similarity can be seen in Figure 7. Comparison of the Phragmites spectra to that of non-Phragmites vegetation revealed that the spectra were distinct from each other and therefore more separated by the target detection algorithm.
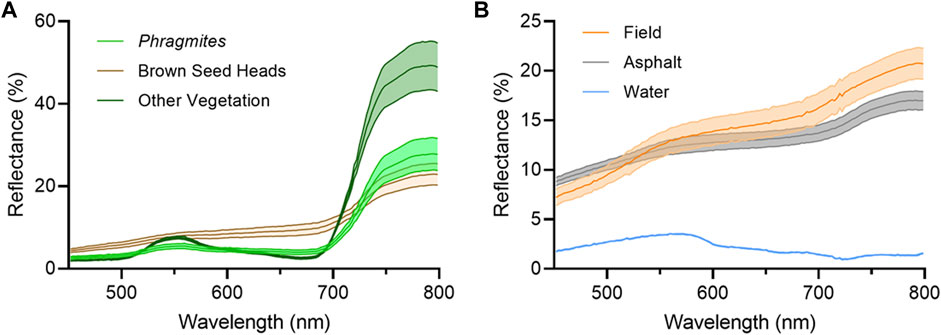
FIGURE 7. The mean spectra (±σ) of each material type used to train the target detection algorithm (A) Phragmites, the brown seed heads, and other non-Phragmites vegetation (B) agricultural fields, asphalt roads, and water.
A total of 2,037 separate stands were detected. The final map showing the extent of detected Phragmites within the park is shown in Figure 5. The total core area of detected Phragmites in the park was 26.74 ha (0.267 km2), which represents approximately 3.28% of the park’s total area of 814 ha (8.14 km2). The average (±σ) polygon size of detected Phragmites is 131.29 ± 571.04 m2 and the frequency distribution of the area of Phragmites polygons is shown in Figure 8. When accounting for the uncertainty indicated by the 2.25 m buffer around each Phragmites polygon, the total area of detected Phragmites was 59.17 ha (0.591 km2), which represents approximately 7.26% of the entire park area. In order to evaluate the performance of the target detection methodology, the calculated confusion matrix is shown in Figure 9.
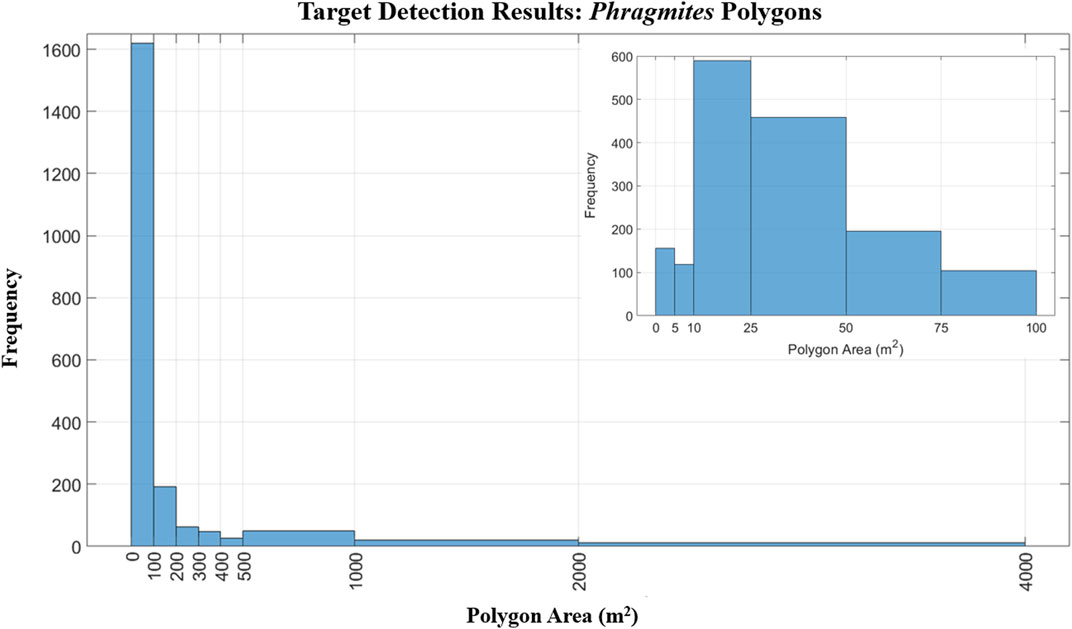
FIGURE 8. The frequency distributions for the sizes of Phragmites polygons present in the final map. The majority of polygons (1,620 out of 2,037) were between 0 and 100 m2: the subset histogram shows the detailed frequency distribution of polygon sizes within this range.
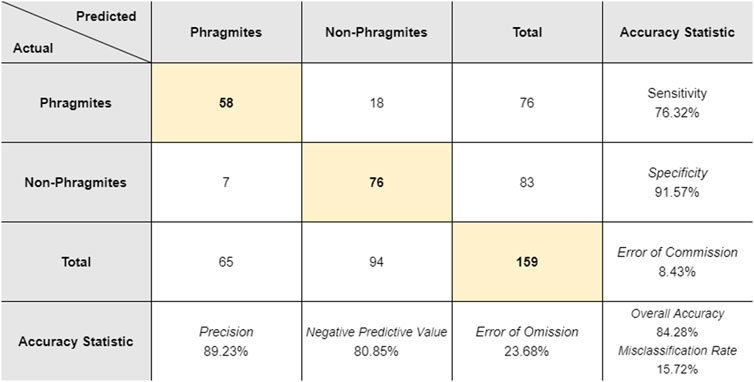
FIGURE 9. The actual and predicted points for the two scenarios (non-Phragmites and Phragmites) for the set of 159 validation ground truth points. The highlighted values on the diagonal represent the number of true positives and true negatives out of the total sample size. Calculated accuracy statistics are shown in the last row and last column.
The overall accuracy of the final map was calculated as 84.28%, with 134 of the total 159 validation points properly identified (true positives). Of the 25 misidentified points, 18 false negatives occurred where the Phragmites stand was not identified correctly. Investigation of these 18 points revealed that nine points occurred where Phragmites stands were a sub-pixel target or were smaller than the MMU (4 m2) and were therefore removed. Similarly, seven ground truth points were collected at the edge of a Phragmites stand where the contribution of Phragmites to the corresponding pixel’s signal was too low to be correctly identified, resulting in false negatives. . For example, the validation point ID = 66 was located 6.58 m from the nearest pixel of identified Phragmites: at this distance, the materials at that point would not contribute any substantial signal to the closest detected pixel of Phragmites, based on the net PSF. The remaining two Phragmites points that were misidentified occurred in Phragmites stands that were predominantly defined by the brown seed heads and brown stems of Phragmites along the margins of water bodies (also false negatives). There were no ground truth points collected for aquatic Phragmites due to lack of accessibility. This reveals the limitations of extrapolating the terrestrial conditions where Phragmites was sampled in situ to vastly different environmental conditions such as aquatic stands. Examples of these three scenarios where Phragmites was misidentified are shown in Figure 10.
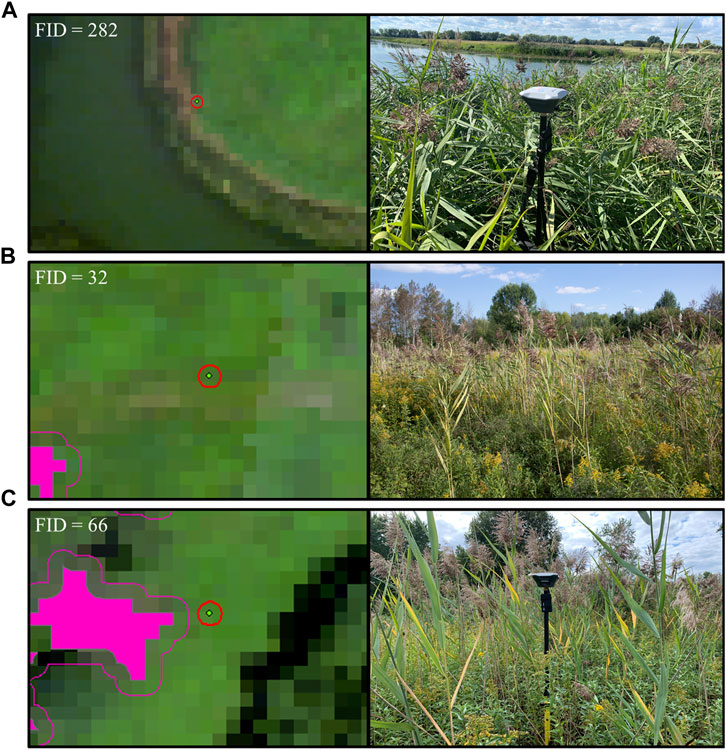
FIGURE 10. Three validation points (FID = 282, 32, and 66) and their 1.75 m error buffers (green dot with red circle) and associated field photographs that demonstrate three of the most common scenarios that caused false negatives in the final detected Phragmites map (pink polygon with 2.25 m error buffer) (A) the stand was predominantly characterized by brown seed heads and stems of Phragmites along the margins of water bodies (B) the stand was a sub-pixel target and was too small to be correctly identified (C) the point was collected at the edge of a larger Phragmites stand, where the Phragmites was too sparse to contribute substantially to the pixels signal. The 2 m tall monopod with the EMLID Reach RS + GNSS receiver is present in subfigures (A,C) to provide a sense of scale.
For this study, the small sample size of target pixels meant that the calculation of a receiver operating characteristic (ROC) curve and associated metrics would not be appropriate (Cisz and Schott, 2005, June). Therefore, using the guidelines regarding the most commonly used accuracy statistics as given by Foody (2002), the sensitivity, specificity, misclassification rate, errors of commission and omission, negative predictive value and precision were calculated and are shown in Figure 9. With a high specificity of 91.57% and a low error of commission of 8.43%, the target detection algorithm distinguished areas that did not contain any Phragmites (Figure 9). The calculated error of omission of 23.68% indicates that there are areas of Phragmites that were not properly identified. These areas most likely occur at sub-pixel Phragmites stands or at the edges of Phragmites stands where the concentration of Phragmites is low (as described above). Overall, the calculated statistics show that the target detection methodology applied in this study had a high overall accuracy and is appropriate for detecting Phragmites within Îles-de-Boucherville National Park. However, a limitation of this method is that small, incipient stands of Phragmites are less likely to be detected. Figure 11 illustrates the differences in the range of SAM detection values for the Phragmites target pixels versus the background pixels. The SAM threshold for Phragmites was set to 0.65 radians, so the associated SAM pixel values fall within that threshold. For the background pixels, there is some overlap with the range of values for Phragmites but the majority of background pixels are associated with pixel values that are higher than 0.65. This shows that there is a separation of the SAM values associated with Phragmites from the values associated with background pixels, allowing for detection of the appropriate target pixels.
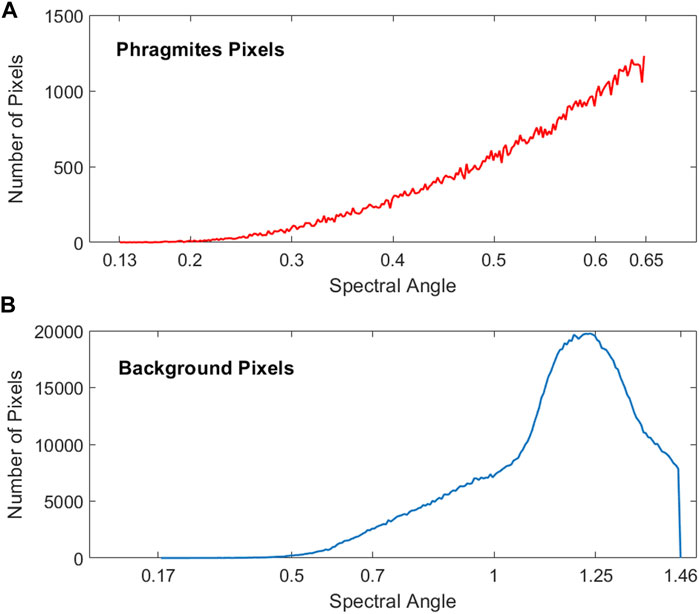
FIGURE 11. The distribution and range of SAM pixel values for (A) target Phragmites pixels and (B) background pixels.
Visual Interpretation Results
A total of 10 visual interpreters assessed the 159 validation ground truth points and surrounding areas within the 15 m buffers. Eight of the interpreters had previously been to Îles-de-Boucherville National Park, and six had some prior knowledge of Phragmites specifically, either from field work or aerial imagery. All visual interpreters were shown several example images of Phragmites and non-Phragmites prior to assessing the validation ground truth points. The overall accuracy of the visual interpretation was 69.18% for Phragmites. For all calculated accuracy statistics (Figure 12), the visual interpretation method underperformed when compared to the target detection results. The human accuracy overall was lower, with higher rates of misclassification (30.82%), error of commission (21.69%), and error of omission (40.79%). Similarly, the sensitivity (59.21%) and specificity (78.31%) were lower than the target detection results by 17.11 and 13.26%, respectively.
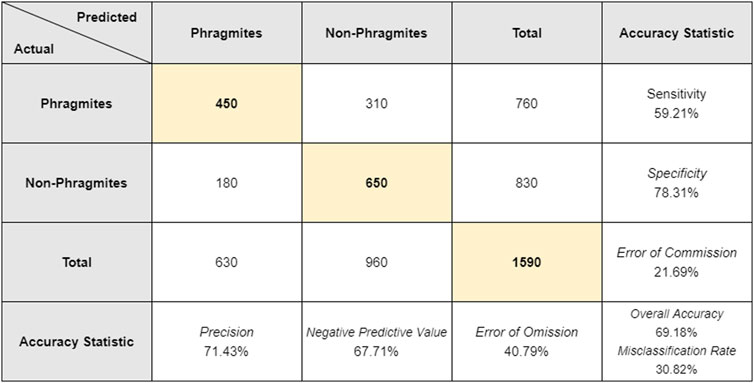
FIGURE 12. The actual and predicted points as determined by the 10 visual interpreters. Each interpreter examined the full set of 159 validation points, leading to a total of 1,590 samples. The highlighted values on the diagonal represent the number of true positives and true negatives out of the total sample size. Calculated accuracy statistics are shown in the last row and last column.
Of the same 18 validation points where Phragmites was incorrectly identified by the target detection algorithm, only two of those points were correctly identified by all 10 visual interpreters. Three of the points were completely misidentified (i.e., none correctly identifying Phragmites in the image). The remaining 13 points of Phragmites were not identified with complete agreement amongst visual interpreters; for seven points >50% of correctly identified Phragmites, for five points <50% correctly identified Phragmites, and at one point where 50% of the visual interpreters identified Phragmites correctly the other 50% did not. The visual interpreters were assessing higher spatial resolution imagery (60 cm) than the HSI (2 m), which might have provided an advantage as the Phragmites in the Satellite Streetview images would potentially be more distinguishable due to the finer spatial resolution (Figure 13). However, the visual interpreters still misidentified some of the same points that the target detection algorithm missed/incorrectly identified, where Phragmites was present in reality but was identified as no Phragmites present: this highlights the shortcomings of visual interpretation of Phragmites using aerial imagery, even amongst experts.
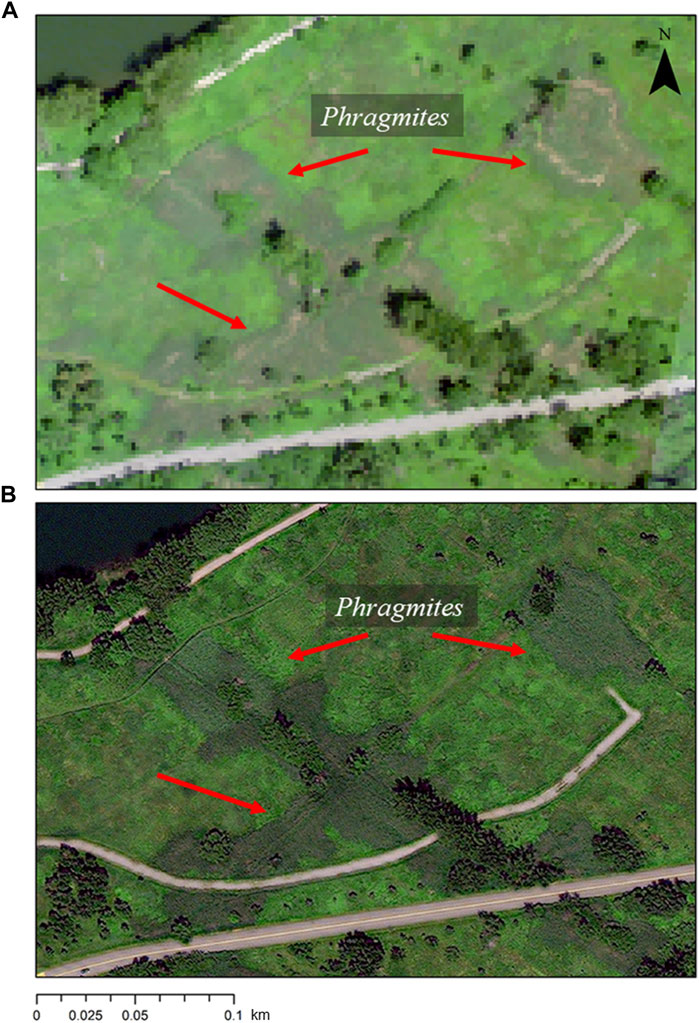
FIGURE 13. An example of the difference in spatial resolution between the Satellite DMTI Streetview imagery used for (A) the visual interpretation (60 cm) and (B) the airborne HSI (2 m). The patches of darker vegetation are stands of Phragmites, as indicated by the red arrows.
Discussion
Our study represents an important advance of airborne hyperspectral remote sensing target detection application and mapping capabilities for Phragmites, and it is the first to determine the extent of Phragmites within the entire of Îles-de-Boucherville National Park. Previous remote sensing studies mapping Phragmites [e.g., Arzandeh and Wang (2003); Pengra et al. (2007); Poulin et al. (2010); Xie et al. (2015)] were typically conducted using spaceborne sensors with lower spatial resolution imagery (e.g., 20 or 30 m), and utilized multispectral imagery instead of HSI. Additionally, such studies utilized conventional image classification rather than target detection algorithms. The overall accuracy of 84.28% for the Phragmites detection (Figure 9) is an improvement when compared to previous remote sensing studies of Phragmites using satellite or airborne HSI. Pengra et al. (2007) achieved an overall accuracy of 81.4% and user’s accuracy of 61.1% using EO-1 Hyperion HSI with a spatial resolution of 30 m (Bachmann et al., 2002). used the HyMap airborne HSI sensor (4.5 m spatial resolution) to identify Phragmites from other wetland vegetation with an accuracy of 68%. The HSI used here with a resampled resolution of 2 m enabled the detection of smaller stands of Phragmites than would be possible from imagery with a lower spatial resolution. For example, the map generated by Pengra et al. (2007) was limited by the spatial resolution of Hyperion and they were not able to map stands of Phragmites smaller than one pixel (90 m2). Their training data required Phragmites sample points to cover an area of at least 180 m2 in order to be considered as a ground truth point. Future Phragmites maps prepared using sensors with specifications similar to the CASI-1500 would provide land managers with a valuable tool they currently lack, and could be modified for various different invasive vegetation species depending on the requirements of the given project. If applying the methods described here, it is necessary to acquire site-specific data (e.g., HSI, ground truth points, etc.) instead of relying on data acquired for a different site or vegetation species.
The identified stands of Phragmites had an average stand size of 131.3 ± 571.04 m2 (Figure 8). In part, this is due to the minimum mapping unit of 16 m2 (four pixels). However, it is also typical for Phragmites to grow extensively and cover a large area rapidly: individual stems can grow up to 4 cm in a single day (Shay and Shay, 1986), and the rhizomes can grow up to 20 m horizontally (Holm et al., 1977), at a rate of up to 40 cm per year (Curtis, 1959). This means that over the course of one growing season, the height profile and coverage area of a given stand can increase to a size detectable by airborne HSI. This prolific growth of Phragmites is one of the reasons early detection and continuous management is needed to effectively control or eradicate populations of Phragmites. The use of other remotely sensed data such as vegetation height from LiDAR was shown to be useful as an ancillary dataset to assist with its detection. While using height as a condition may exclude new stands or stands that have not yet developed a substantial vertical profile, it would be applicable for more established stands that are likely to be vertically developed.
As mentioned in Target Detection Results and Accuracy section, 18 of the 25 misidentified validation points occurred where Phragmites was missed. The majority of these points (16 out of 18) occurred where Phragmites was present as a sub-pixel target (i.e., smaller than the 2 m pixel size of the HSI) or at the edge of Phragmites stands where their relative contribution to the pixels’ signal was too low to be correctly identified as Phragmites due to the extent of the CASI’s net PSF (Inamdar et al., 2020). Due to the nature of sensor geometries, it is common that a pixel is comprised of an assortment of materials that contribute to the overall signal of that pixel: these mixed pixels occur where the sensor spatial resolution is low enough that the signal from a given pixel originates from an area containing different materials, or if the materials are combined as a homogeneous mixture (Hsieh et al., 2001; Keshava and Mustard, 2002). Future attempts at mapping Phragmites using target detection methods with HSI would potentially be able to improve the accuracy of sub-pixel targets through the use of spectral unmixing techniques [e.g., Frazier and Wang (2011) and Asner et al. (2008b)]. The ability to more accurately detect the less dense edges of Phragmites stands would be advantageous as it would allow for improved detection and monitoring of the expansion of established stands, or the detection of newly established stands that have not yet grown dense enough to be readily detected, as commonly occurs during new invasions. This illustrates the importance of the sensor’s unique PSF and resampled pixel size, as well as the spectral difference and spatial extent of the vegetation species of interest as compared to background materials: these characteristics must be sufficient for the desired application. The other two false negatives occurred where Phragmites was not detected in stands along the edges of water bodies, and stands that were dominated by brown seed heads. These seed heads are spectrally distinct from the green portion of the Phragmites plant (as seen in Figure 7), and their prevalence as part of a Phragmites stand is dependent on the season. Depending on when imagery is acquired, these seed heads may represent only a minimal portion of Phragmites stands. The spectral similarity between the brown seed heads and areas of dry soil/vegetation (such as agricultural fields) led to the confusion of these two materials by the target detection algorithm. While training data of these seed heads were included, additional training data would likely improve the target detection performance. Similarly, there were no aquatic ground truth points collected for Phragmites as these areas were not accessible for sampling. Though the focus of this research was mapping terrestrial Phragmites, future improvements could be made by including samples of aquatic habitats as the park has a substantial population of aquatic Phragmites. Including these stands would be beneficial for a more comprehensive indication of Phragmites presence within the park. However, the SEPAQ park management conservation plan is currently focused on the management of terrestrial Phragmites as part of restoring former agricultural fields back to their original environments (Société des établissements de plein air du Québec, 2020), so emphasis on mapping terrestrial Phragmites is still appropriate for their needs.
Seven validation points were false positives: examination of these points revealed that all of the points were acquired at locations where the perennial grass Phalaris arundinacea (hereafter Phalaris) was present. Also known as reed canary grass, P. ahalaris is from the same family of Poaceae as Phragmites and is generally considered native to most areas of North America, although invasive populations are becoming more established and spreading rapidly (Lavergne and Molofsky, 2004). P. a is functionally similar to Phragmites and spreads via rhizome mats that form dense monotypic stands which grow between 0.6 and 2 m tall (Figure 14) and can reduce plant and insect biodiversity (Apfelbaum and Sams, 1987; Lavergne and Molofsky, 2004). It is found in similar habitats as Phragmites and occurs throughout Îles-de-Boucherville National Park. A linear discriminant analysis performed using leaf-level spectral data of 12 vegetation species present in the park found that while Phragmites was spectrally distinct from all other species, it was most similar to Phalaris (Schweiger, 2019). This spectral similarity between the two species could explain why the false positives occurred exclusively at areas of Phalaris coverage. Additional ground truth sampling and refined training data could help improve target detection accuracy with regards to separating Phragmites from Phalaris.
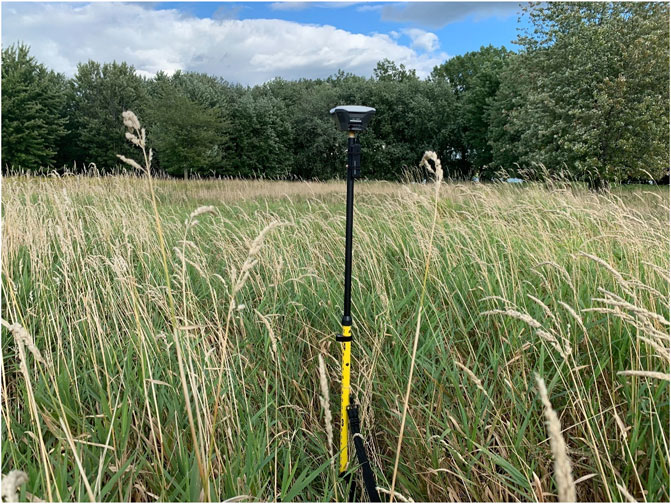
FIGURE 14. A photo of a large expanse of Phalaris arundinacea taken within Îles-de-Boucherville National Park. The 2 m tall monopod with the EMLID Reach RS + GNSS receiver is present in the photograph to provide context of scale.
When compared to the visual interpretation results, which had an overall accuracy of 69.18%, the Phragmites target detection performed better in every calculated accuracy statistic. The visual interpretation had a lower overall accuracy than the target detection and therefore a higher rate of misclassification. The visual interpretation error of commission of 21.69% (Figure 12), compared to 8.43% for the target detection (Figure 9), indicates that the human interpreters were more likely to falsely identify Phragmites as being present when in reality it was not. Similarly, the higher rate of omission (40.79%, compared to 23.68% for the target detection results), indicates that the interpreters were less capable at identifying when Phragmites was actually present. Altogether, these results indicate that expert human interpretation of the validation points did not yield as accurate results as the algorithm-based target detection methodology. Additionally, traditional methods of visual interpretation that typically rely upon publicly available datasets, such as the 2012 high-resolution imagery used in this study, are limited to using the datasets that are available at the time, regardless of when they were acquired. Airborne imagery can be more flexible in terms of planning data acquisition and can be more advantageous for timing field data collection and other necessary data. These are important considerations when planning and collecting data for similar studies regarding vegetation species identification (native or invasive) and management. Traditional methods of visual interpretation also used aerial stereoscopic photograph pairs and interpretation by a trained expert: given the considerable height profile of Phragmites compared to the other surrounding vegetation species, the stereoscopic pairs could be used to help verify points based on their height profile (Fensham et al., 2002). However, these datasets are becoming increasingly rare and expensive to acquire, which may make them impractical for studies similar to the one described here.
The overall accuracy and benefits yielded by the end product using airborne HSI indicate that the relatively high investment of this technology might be worthwhile when compared to human interpretation of readily available high spatial resolution data. In addition, airborne HSI would be key for validating novel spaceborne hyperspectral sensors, such as the Environmental Mapping and Analysis Program (EnMAP), Hyperspectral Imager Suite (HISUI), and the Hyperspectral Precursor and Application Mission (PRISMA), and Planet Labs hyperspectral constellation. The spaceborne HSI systems typically include a large number of bands (e.g., 185–242 bands for the previously listed sensors) with a spatial resolution of 20 or 30 m. Therefore, the ability to scale up remote sensing of invasive species will be determined by the capabilities of such satellite sensors. The newer hyperspectral sensors mentioned above are still limited in their spatial resolution, which might impede their ability to detect invasive species at smaller (sub-pixel) stand sizes. However, given recent improvements in spectral unmixing techniques and other analysis methods such as deep learning [e.g., Cabezas et al. (2020)], such sensors would likely be efficient at large-scale mapping of invasive species, which could benefit studies seeking to map invasions across broader scales such as regions or countries. These sensors will likely have their niche, and future research utilizing such data would greatly help with understanding their capabilities regarding mapping invasive species along with other areas of study. The utilization of these current sensors for research would also help to reveal their strengths and limitations, which could highlight considerations to keep in mind while planning future sensors.
When considering a satellite, airborne, or Remotely Piloted Aircraft Systems (RPAS) platform, there are other tradeoffs related to cost, user experience, and temporal availability that must be carefully considered for each mapping project and its requirements (Matese et al., 2015; Khaliq et al., 2019). Research into the use of RPAS to map vegetation is becoming more common and could provide another alternative to mapping Phragmites at relatively lower costs, as RPAS can be obtained at various price points and can be customized for a variety of sensor payloads including HSI (Arroyo-Mora et al., 2019; Kalacska et al., 2020). Recent studies [e.g., Brooks et al. (2021); Abeysinghe et al. (2019); Anderson et al. (2021); Kopeć et al. (2019)] have successfully utilized RPAS to map Phragmites at different field sites with reasonably accurate results. Current RPAS platforms are usually limited by shorter flight times, lighter payloads, and the requirement to remain within visual line of sight (VLOS) of the operator, which can make them a less opportune platform for acquiring data over large areas. However, with the phasing-in of beyond visual line of sight (BVLOS) activity, future studies conducted with a RPAS will be able to fly further from the operator in order to cover a larger area than previously allowed by VLOS rules.
Conclusion
Airborne hyperspectral imagery has been shown to be adequate for the mapping of invasive Phragmites over a moderate spatial extent of 8.14 km2. Target detection, coupled with a thorough ground truth dataset and firm understanding of the site-specific characteristics, can yield reasonably accurate vegetation species extent maps. By utilizing airborne HSI with a relatively fine resampled pixel size (2 m), this study produced an extensive map of Phragmites within Îles-de-Boucherville National Park with an overall accuracy of 84.28%. This map represents a first-of-its-kind effort to map Phragmites for the entire park through the use of airborne HSI and target detection methods. The map’s high level of accuracy will allow park management to better understand the extent of Phragmites in the park, and therefore better plan their future management and conservation strategies. The methodology described here could be readily modified or customized to fit specific research needs (e.g., different study sites or vegetation species of interest) given the proper care is taken to plan and implement the data acquisition and analysis. Such an approach would be useful for future studies of Phragmites in different environments, as well as mapping other vegetation species of interest, invasive or otherwise, depending on the location and the nature of the surrounding vegetation communities. Given the prolific nature of Phragmites, frequent and accurate mapping would assist greatly with attempts to eradicate populations or control its spread.
Data Availability Statement
The datasets presented in this article are not readily available because the imagery presented in this article are available from the corresponding author upon request following the CABO data use agreement from https://cabo.geog.mcgill.ca. Requests to access the datasets should be directed to caboscience@gmail.com. Additionally, the ground truth datasets are described in detail in Elmer and Kalacska (2021) available at https://doi.org/10.3390/data6030032, and the associated ground truth dataset is available for download at http://doi.org/10.5281/zenodo.4504922. The dataset containing the final Phragmites map shapefiles is available for download at: http://doi.org/10.5683/SP3/MAOLHV.
Author Contributions
Conceptualization: KE and MK. Methodology: KE and MK. Validation: KE. Formal analysis: KE. Investigation: KE. Resources: JA-M. Data acquisition: KE, MK, and JA-M. Data curation: KE, MK, and JA-M. Writing–original draft preparation: KE. Writing–review and editing: KE, MK, and JA-M. Visualization: KE and JA-M.
Funding
This research was funded by a Natural Sciences and Engineering Research Council (NSERC) Discovery Frontiers grant that was awarded to support the Canadian Airborne Biodiversity Observatory (CABO). Additional funding was provided by the McGill Department of Geography Rathlyn Fellowship in Geography (to KE).
Conflict of Interest
The authors declare that the research was conducted in the absence of any commercial or financial relationships that could be construed as a potential conflict of interest.
Publisher’s Note
All claims expressed in this article are solely those of the authors and do not necessarily represent those of their affiliated organizations, or those of the publisher, the editors and the reviewers. Any product that may be evaluated in this article, or claim that may be made by its manufacturer, is not guaranteed or endorsed by the publisher.
Acknowledgments
We would like to acknowledge the SÉPAQ team at Îles-de-Boucherville National Park, especially Nathalie Rivard, for their support with logistics during both the airborne HSI and field data collection campaigns. We thank Raymond Soffer and Deep Inamdar for the preprocessing of the CASI-1500 imagery, Nicolas Cadieux for assistance with the LiDAR data, Oliver Lucanus for his photograph of Phragmites, and Daniel Larkin, Gail Chmura and three Reviewers for their valuable feedback. We also thank Gillian Rowan, Patrick Osei Darko, Deep Inamdar and Erica Skye Schaaf for field assistance during the acquisition of the CASI-1500 imagery. Access to the DMTI Satellite Streetview imagery was provided by the McGill Library. We would also like to thank the 10 visual interpreters for their time and assistance in assessing the validation imagery.
References
Abeysinghe, T., Simic Milas, A., Arend, K., Hohman, B., Reil, P., Gregory, A., et al. (2019). Mapping Invasive Phragmites Australis in the Old Woman Creek Estuary Using UAV Remote Sensing and Machine Learning Classifiers. Remote Sensing 11 (11), 1380. doi:10.3390/rs11111380
Alam, M. S., and Sidike, P. (2012). “Trends in Oil Spill Detection via Hyperspectral Imaging,” in Paper presented at the 2012 7th International Conference on Electrical and Computer Engineering, Dhaka, Bangladesh, 20-22 Dec. 2012 (IEEE). doi:10.1109/ICECE.2012.6471686
Anderson, C. J., Heins, D., Pelletier, K. C., Bohnen, J. L., and Knight, J. F. (2021). Mapping Invasive Phragmites Australis Using Unoccupied Aircraft System Imagery, Canopy Height Models, and Synthetic Aperture Radar. Remote Sensing 13 (16), 3303. doi:10.3390/rs13163303
Apfelbaum, S. I., and Sams, C. E. (1987). Ecology and Control of Reed Canary Grass (Phalaris Arundinacea L.). Nat. Areas J. 7 (2), 69–74.
Arroyo-Mora, J., Kalacska, M., Inamdar, D., Soffer, R., Lucanus, O., Gorman, J., et al. (2019). Implementation of a UAV-Hyperspectral Pushbroom Imager for Ecological Monitoring. Drones 3 (1), 12. doi:10.3390/drones3010012
Arzandeh, S., and Wang, J. (2003). Monitoring the Change ofPhragmitesdistribution Using Satellite Data. Can. J. Remote Sensing 29 (1), 24–35. doi:10.5589/m02-077
Asner, G. P., Jones, M. O., Martin, R. E., Knapp, D. E., and Hughes, R. F. (2008a). Remote Sensing of Native and Invasive Species in Hawaiian Forests. Remote Sensing Environ. 112 (5), 1912–1926. doi:10.1016/j.rse.2007.02.043
Asner, G. P., Knapp, D. E., Kennedy-Bowdoin, T., Jones, M. O., Martin, R. E., Boardman, J., et al. (2008b). Invasive Species Detection in Hawaiian Rainforests Using Airborne Imaging Spectroscopy and LiDAR. Remote Sensing Environ. 112 (5), 1942–1955. doi:10.1016/j.rse.2007.11.016
Avers, B., Fahlsing, R., Kafcas, E., Schafer, J., Collin, T., Esman, L., et al. (2007). A Guide to the Control and Management of Invasive Phragmites. Lansing: Michigan Department of Environmental Quality.
Bachmann, C. M., Donato, T. F., Lamela, G. M., Rhea, W. J., Bettenhausen, M. H., Fusina, R. A., et al. (2002). Automatic Classification of Land Cover on Smith Island, VA, Using HyMAP Imagery. IEEE Trans. Geosci. Remote Sensing 40 (10), 2313–2330. doi:10.1109/tgrs.2002.804834
Belzile, F., Labbé, J., LeBlanc, M.-C., and Lavoie, C. (2010). Seeds Contribute Strongly to the Spread of the Invasive Genotype of the Common Reed (Phragmites Australis). Biol. Invasions 12 (7), 2243–2250. doi:10.1007/s10530-009-9634-x
Boardman, J. (1998). “Post-ATREM Polishing of AVIRIS Apparent Reflectance Data Using EFFORT: a Lesson in Accuracy versus Precision,” in Paper presented at the Summaries of the Seventh JPL Airborne Earth Science Workshop, Pasadena, CA, 12-16 January 1998 (Pasadena CA: JPL Publication).
Boardman, J. (1993). Spectral Angle Mapping: A Rapid Measure of Spectral Similarity. AVIRIS. Delivered by Ingenta.
Brooks, C., Weinstein, C., Poley, A., Grimm, A., Marion, N., Bourgeau-Chavez, L., et al. (2021). Using Uncrewed Aerial Vehicles for Identifying the Extent of Invasive Phragmites Australis in Treatment Areas Enrolled in an Adaptive Management Program. Remote Sensing 13 (10), 1895. doi:10.3390/rs13101895
Cabezas, M., Kentsch, S., Tomhave, L., Gross, J., Caceres, M. L. L., and Diez, Y. (2020). Detection of Invasive Species in Wetlands: Practical DL with Heavily Imbalanced Data. Remote Sensing 12 (20), 3431. doi:10.3390/rs12203431
Chambers, R. M., Meyerson, L. A., and Saltonstall, K. (1999). Expansion of Phragmites Australis into Tidal Wetlands of North America. Aquat. Bot. 64 (3-4), 261–273. doi:10.1016/s0304-3770(99)00055-8
Cisz, A. P., and Schott, J. R. (2005). Performance Comparison of Hyperspectral Target Detection Algorithms in Altitude Varying Scenes. Algorithms Tech. Multispectral, Hyperspectral, Ultraspectral Imagery XI 5806, 839–849. doi:10.1117/12.603768
Cronk, Q., and Fuller, J. (2001). Plant Invaders: The Threat to Natural Ecosystems. London, UK: Earthscan Publications.
Curtis, J. T. (1959). The Vegetation of Wisconsin: An Ordination of Plant Communities. Madison, Wisconsin: University of Wisconsin Press.
Danylo, O., Pirker, J., Lemoine, G., Ceccherini, G., See, L., McCallum, I., et al. (2021). A Map of the Extent and Year of Detection of Oil palm Plantations in Indonesia, Malaysia and Thailand. Scientific data 8 (1), 1–8. doi:10.1038/s41597-021-00867-1
Early, R., Bradley, B. A., Dukes, J. S., Lawler, J. J., Olden, J. D., Blumenthal, D. M., et al. (2016). Global Threats from Invasive Alien Species in the Twenty-First century and National Response Capacities. Nat. Commun. 7 (1), 12485–12489. doi:10.1038/ncomms12485
Elmer, K., and Kalacska, M. (2021). A High-Accuracy GNSS Dataset of Ground Truth Points Collected within Îles-De-Boucherville National Park, Quebec, Canada. Data 6 (3), 32. doi:10.3390/data6030032
Fensham, R. J., Fairfax, R. J., Holman, J. E., and Whitehead, P. J. (2002). Quantitative Assessment of Vegetation Structural Attributes from Aerial Photography. Int. J. Remote Sensing 23 (11), 2293–2317. doi:10.1080/01431160110106050
Foody, G. M. (2002). Status of Land Cover Classification Accuracy Assessment. Remote Sensing Environ. 80 (1), 185–201. doi:10.1016/s0034-4257(01)00295-4
Frazier, A. E., and Wang, L. (2011). Characterizing Spatial Patterns of Invasive Species Using Sub-pixel Classifications. Remote Sensing Environ. 115 (8), 1997–2007. doi:10.1016/j.rse.2011.04.002
Getsinger, K., Nelson, L., Glomski, L., Kafcas, E., Schafer, J., Kogge, S., et al. (2006). Control of Phragmites in a Michigan Great Lakes Marsh. Lansing, MI: Final Report to the Michigan Department of Natural Resources.
Giroux, L. (1986). Synthèse et cartographie du potentiel biophysique et humain du. Parc des Îles-de-Boucherville: Département des sciences de l'environnement, 200.
Goodrich, S., and Neese, E. (1986). Uinta Basin flora. Ogden, UT: USDA Forest Service-Intermountain Region.
Green, A. A., Berman, M., Switzer, P., and Craig, M. D. (1988). A Transformation for Ordering Multispectral Data in Terms of Image Quality with Implications for Noise Removal. IEEE Trans. Geosci. Remote Sensing 26 (1), 65–74. doi:10.1109/36.3001
Gross, M. F., Hardisky, M. A., and Klemas, V. (1988). Effects of Solar Angle on Reflectance from Wetland Vegetation. Remote Sensing Environ. 26 (3), 195–212. doi:10.1016/0034-4257(88)90077-6
Große-Stoltenberg, A., Hellmann, C., Werner, C., Oldeland, J., and Thiele, J. (2016). Evaluation of Continuous VNIR-SWIR Spectra versus Narrowband Hyperspectral Indices to Discriminate the Invasive Acacia Longifolia within a Mediterranean Dune Ecosystem. Remote Sensing 8 (4), 334. doi:10.3390/rs8040334
Hastings, A., Hall, R. J., and Taylor, C. M. (2006). A Simple Approach to Optimal Control of Invasive Species. Theor. Popul. Biol. 70 (4), 431–435. doi:10.1016/j.tpb.2006.05.003
He, K. S., Rocchini, D., Neteler, M., and Nagendra, H. (2011). Benefits of Hyperspectral Remote Sensing for Tracking Plant Invasions. Divers. Distributions 17 (3), 381–392. doi:10.1111/j.1472-4642.2011.00761.x
Holm, L. G., Plucknett, D. L., Pancho, J. V., and Herberger, J. P. (1977). The World's Worst Weeds: Distribution and Biology. Honolulu, Hawaii: University Press of Hawaii.
Huang, C.-y., and Asner, G. (2009). Applications of Remote Sensing to Alien Invasive Plant Studies. Sensors 9 (6), 4869–4889. doi:10.3390/s90604869
Huang, C., Townshend, J. R. G., Liang, S., Kalluri, S. N. V., and DeFries, R. S. (2002). Impact of Sensor's point Spread Function on Land Cover Characterization: Assessment and Deconvolution. Remote Sensing Environ. 80 (2), 203–212. doi:10.1016/s0034-4257(01)00298-x
Hudon, C., Gagnon, P., and Jean, M. (2005). Hydrological Factors Controlling the Spread of Common Reed (Phragmites Australis) in theSt. Lawrence River (Québec, Canada). Écoscience 12 (3), 347–357. doi:10.2980/i1195-6860-12-3-347.1
Inamdar, D., Kalacska, M., Leblanc, G., and Arroyo-Mora, J. P. (2020). Characterizing and Mitigating Sensor Generated Spatial Correlations in Airborne Hyperspectral Imaging Data. Remote Sensing 12 (4), 641. doi:10.3390/rs12040641
IUCN (2017). “The IUCN Red List of Threatened Species,”. Version 2017–3 (The IUCN Red List of Threatened Species 2017). Available at: www.iucnredlist.org.
Jodoin, Y., Lavoie, C., Villeneuve, P., Theriault, M., Beaulieu, J., and Belzile, F. (2008). Highways as Corridors and Habitats for the Invasive Common reedPhragmites Australisin Quebec, Canada. J. Appl. Ecol. 45 (2), 459–466. doi:10.1111/j.1365-2664.2007.01362.x
Joshi, C., De Leeuw, J., and van Duren, I. C. (2004). “Remote Sensing and GIS Applications for Mapping and Spatial Modelling of Invasive Species,” in Paper presented at the XX ISPRS Congress, Proceedings and Results, Istanbul, Turkey, 12-23 July 2004 (Istanbul, Turkey: ISPRS), 669–677.
Kalacska, M., Lucanus, O., Arroyo-Mora, J., Laliberté, É., Elmer, K., Leblanc, G., et al. (2020). Accuracy of 3D Landscape Reconstruction without Ground Control Points Using Different UAS Platforms. Drones 4 (2), 13. doi:10.3390/drones4020013
Keshava, N., and Mustard, J. F. (2002). Spectral Unmixing. IEEE Signal. Process. Mag. 19 (1), 44–57. doi:10.1109/79.974727
Khaliq, A., Comba, L., Biglia, A., Ricauda Aimonino, D., Chiaberge, M., and Gay, P. (2019). Comparison of Satellite and UAV-Based Multispectral Imagery for Vineyard Variability Assessment. Remote Sensing 11 (4), 436. doi:10.3390/rs11040436
Kopeć, D., Zakrzewska, A., Halladin-Dąbrowska, A., Wylazłowska, J., Kania, A., and Niedzielko, J. (2019). Using Airborne Hyperspectral Imaging Spectroscopy to Accurately Monitor Invasive and Expansive Herb Plants: Limitations and Requirements of the Method. Sensors 19 (13), 2871.
Kruse, F. A., Lefkoff, A., Boardman, J., Heidebrecht, K., Shapiro, A., Barloon, P., et al. (1993). The Spectral Image Processing System (SIPS)—interactive Visualization and Analysis of Imaging Spectrometer Data. Remote Sensing Environ. 44 (2-3), 145–163. doi:10.1016/0034-4257(93)90013-n
Laliberté, E., Cogliastro, A., and Bouchard, A. (2006). Projet Pilote de Restauration de Paysages Forestiers au Parc National des Îles-de-Boucherville. Rapport final présenté à la direction du parc national des îles-de-Boucherville, Société des établissements de plein air du Québec (SÉPAQ). Montréal: Institut de recherche en biologie végétale.
Landgrebe, D. (2002). Hyperspectral Image Data Analysis. IEEE Signal. Process. Mag. 19 (1), 17–28. doi:10.1109/79.974718
Lass, L. W., Prather, T. S., Glenn, N. F., Weber, K. T., Mundt, J. T., and Pettingill, J. (2005). A Review of Remote Sensing of Invasive Weeds and Example of the Early Detection of Spotted Knapweed (Centaurea Maculosa) and Babysbreath (Gypsophila Paniculata) with a Hyperspectral Sensor. Weed Sci. 53 (2), 242–251. doi:10.1614/ws-04-044r2
Lavergne, S., and Molofsky, J. (2004). Reed Canary Grass (Phalaris Arundinacea) as a Biological Model in the Study of Plant Invasions. Crit. Rev. Plant Sci. 23 (5), 415–429. doi:10.1080/07352680490505934
Lelong, B., Lavoie, C., Jodoin, Y., and Belzile, F. (2007). Expansion Pathways of the Exotic Common Reed ( Phragmites Australis ): a Historical and Genetic Analysis. Divers. Distributions 13 (4), 430–437. doi:10.1111/j.1472-4642.2007.00351.x
Leung, B., Lodge, D. M., Finnoff, D., Shogren, J. F., Lewis, M. A., and Lamberti, G. (2002). An Ounce of Prevention or a Pound of Cure: Bioeconomic Risk Analysis of Invasive Species. Proc. R. Soc. Lond. B 269 (1508), 2407–2413. doi:10.1098/rspb.2002.2179
Mack, R. N., Simberloff, D., Mark Lonsdale, W., Evans, H., Clout, M., and Bazzaz, F. A. (2000). Biotic Invasions: Causes, Epidemiology, Global Consequences, and Control. Ecol. Appl. 10 (3), 689–710. doi:10.1890/1051-0761(2000)010[0689:bicegc]2.0.co;2
Martin, L. J., and Blossey, B. (2013). The Runaway weed: Costs and Failures of Phragmites Australis Management in the USA. Estuaries and Coasts 36 (3), 626–632. doi:10.1007/s12237-013-9593-4
Matese, A., Toscano, P., Di Gennaro, S., Genesio, L., Vaccari, F., Primicerio, J., et al. (2015). Intercomparison of UAV, Aircraft and Satellite Remote Sensing Platforms for Precision Viticulture. Remote Sensing 7 (3), 2971–2990. doi:10.3390/rs70302971
Molan, Y. E., Refahi, D., and Tarashti, A. H. (2014). Mineral Mapping in the Maherabad Area, Eastern Iran, Using the HyMap Remote Sensing Data. Int. J. Appl. Earth Observation Geoinformation 27, 117–127. doi:10.1016/j.jag.2013.09.014
Morisette, J. T., Jarnevich, C. S., Ullah, A., Cai, W., Pedelty, J. A., Gentle, J. E., et al. (2006). A Tamarisk Habitat Suitability Map for the continental United States. Front. Ecol. Environ. 4 (1), 11–17. doi:10.1890/1540-9295(2006)004[0012:athsmf]2.0.co;2
Pejchar, L., and Mooney, H. A. (2009). Invasive Species, Ecosystem Services and Human Well-Being. Trends Ecol. Evol. 24 (9), 497–504. doi:10.1016/j.tree.2009.03.016
Pengra, B. W., Johnston, C. A., and Loveland, T. R. (2007). Mapping an Invasive Plant, Phragmites Australis, in Coastal Wetlands Using the EO-1 Hyperion Hyperspectral Sensor. Remote Sensing Environ. 108 (1), 74–81. doi:10.1016/j.rse.2006.11.002
Pi-Fuei Hsieh, P.-F., Lee, L. C., and Nai-Yu Chen, N.-Y. (2001). Effect of Spatial Resolution on Classification Errors of Pure and Mixed Pixels in Remote Sensing. IEEE Trans. Geosci. Remote Sensing 39 (12), 2657–2663. doi:10.1109/36.975000
Pimentel, D., Zuniga, R., and Morrison, D. (2005). Update on the Environmental and Economic Costs Associated with Alien-Invasive Species in the United States. Ecol. Econ. 52 (3), 273–288. doi:10.1016/j.ecolecon.2004.10.002
Poulin, B., Davranche, A., and Lefebvre, G. (2010). Ecological Assessment of Phragmites Australis Wetlands Using Multi-Season SPOT-5 Scenes. Remote Sensing Environ. 114 (7), 1602–1609. doi:10.1016/j.rse.2010.02.014
Ranson, K. J., Daughtry, C. S. T., and Biehl, L. L. (1986). Background Effects on Spectral Response of Simulated Balsam Fir Canopies. Photogrammetric Eng. Remote Sensing 52 (5), 649–658.
Ready, P., and Wintz, P. (1973). Information Extraction, SNR Improvement, and Data Compression in Multispectral Imagery. IEEE Trans. Commun. 21 (10), 1123–1131. doi:10.1109/tcom.1973.1091550
Richter, R., and Schläpfer, D. (2011). “Atmospheric/topographic Correction for Airborne Imagery,”. ATCOR-4 user guide, 565–502.
Rocchini, D., Andreo, V., Förster, M., Garzon-Lopez, C. X., Gutierrez, A. P., Gillespie, T. W., et al. (2015). Potential of Remote Sensing to Predict Species Invasions. Prog. Phys. Geogr. Earth Environ. 39 (3), 283–309. doi:10.1177/0309133315574659
Ross, M. (1990). Étude sur l’évolution de boisé Grosbois au Parc des Îles-de-Boucherville. Parcs de la Montérégie: Service de la gestion des ressources naturelles.
Salles, R. d. R., De Souza Filho, C. R., Cudahy, T., Vicente, L. E., and Monteiro, L. V. S. (2017). Hyperspectral Remote Sensing Applied to Uranium Exploration: A Case Study at the Mary Kathleen Metamorphic-Hydrothermal U-REE deposit, NW, Queensland, Australia. J. Geochemical Exploration 179, 36–50. doi:10.1016/j.gexplo.2016.07.002
Saltonstall, K. (2002). Cryptic Invasion by a Non-native Genotype of the Common Reed, Phragmites Australis, into North America. Proc. Natl. Acad. Sci. 99 (4), 2445–2449. doi:10.1073/pnas.032477999
Saltonstall, K., Peterson, P. M., and Soreng, R. J. (2004). Recognition of Phragmites Australis Subsp. Americanus (Poacea: Arundinoideae) in North America: Evidence from Morphological and Genetic Analyses. SIDA, Contrib. Bot. 21 (2), 683–692.
Schweiger, A. (2019). Spectral Diversity, Spectral Species Differentiation and Intra-individual Variability in Leaf Traits and Spectra. Paper presented at the 2019 CABO 2nd Annual Meeting (Montreal, Quebec: Canada).
Shaw, D. R. (2005). Translation of Remote Sensing Data into weed Management Decisions. Weed Sci. 53 (2), 264–273. doi:10.1614/ws-04-072r1
Shay, J. M., and Shay, C. T. (1986). Prairie Marshes in Western Canada, with Specific Reference to the Ecology of Five Emergent Macrophytes. Can. J. Bot. 64 (2), 443–454. doi:10.1139/b86-059
Skowronek, S., Ewald, M., Isermann, M., Van De Kerchove, R., Lenoir, J., Aerts, R., et al. (2017). Mapping an Invasive Bryophyte Species Using Hyperspectral Remote Sensing Data. Biol. Invasions 19 (1), 239–254. doi:10.1007/s10530-016-1276-1
Société des établissements de plein air du Québec (2020). Parc National Des Îles-De-Boucherville: Portait of the Park. Available at:https://www.sepaq.com/pq/bou/decouvrir/portrait.dot?language_id=1.
Soffer, R. J., Ifimov, G., Arroyo-Mora, J. P., and Kalacska, M. (2019). Validation of Airborne Hyperspectral Imagery from Laboratory Panel Characterization to Image Quality Assessment: Implications for an Arctic Peatland Surrogate Simulation Site. Can. J. Remote Sensing 45 (3-4), 476–508. doi:10.1080/07038992.2019.1650334
Soulé, M. E. (1992). The Social and Public Health Implications of Global Warming and the Onslaught of Alien Species. J. Wilderness Med. 3 (2), 118–127. doi:10.1580/0953-9859-3.2.118
Sturtevant, R., Reid, D., and Raikow, D. (2019). Phragmites Australis Australis (Cav.) Trin. Ex Steud.: U.S. Geological Survey, Nonindigenous Aquatic Species Database, Gainesville, FL, and NOAA Great Lakes Aquatic Nonindigenous Species Information System. Ann Arbor, MI. Available at:https://nas.er.usgs.gov/queries/greatlakes/FactSheet.aspx?SpeciesID=2937.
Tulbure, M. G., Johnston, C. A., and Auger, D. L. (2007). Rapid Invasion of a Great Lakes Coastal Wetland by Non-native Phragmites Australis and Typha. J. Great Lakes Res. 33, 269–279. doi:10.3394/0380-1330(2007)33[269:rioagl]2.0.co;2
Underwood, E., Ustin, S., Pauchard, A., Maheu-Giroux, M., and Browne, M. (2007). Trends in Invasive Alien Species. Paper Presented at the Sourcebook on Remote Sensing and Biodiversity Indicators. Montreal, Technical Series: Secretariat of the Convention on Biological Diversity.
U.S. Congress Office of Technology Assessment (1993). Harmful Non-indigenous Species in the United States, OTA-F-565. Washington, DC, USA: U.S. Government Printing Office.
Westbrooks, R. G. (2004). New Approaches for Early Detection and Rapid Response to Invasive Plants in the United States1. Weed Tech. 18 (sp1), 1468–1471. doi:10.1614/0890-037x(2004)018[1468:nafeda]2.0.co;2
Xie, Y., Zhang, A., and Welsh, W. (2015). Mapping Wetlands and Phragmites Using Publically Available Remotely Sensed Images. Photogramm Eng. Remote Sensing 81 (1), 69–78. doi:10.14358/pers.81.1.69
Keywords: remote sensing, invasive species, common reed, ecological management, target detection, CASI-1500 sensor
Citation: Elmer K, Kalacska M and Arroyo-Mora JP (2021) Mapping the Extent of Invasive Phragmites australis subsp. australis From Airborne Hyperspectral Imagery. Front. Environ. Sci. 9:757871. doi: 10.3389/fenvs.2021.757871
Received: 12 August 2021; Accepted: 13 October 2021;
Published: 28 October 2021.
Edited by:
Xuan Zhu, Monash University, AustraliaReviewed by:
Davood Akbari, Zabol University, IranRoozbeh Rajabi, Qom University of Technology, Iran
Qian Du, GNS Healthcare, United States
Copyright © 2021 Elmer, Kalacska and Arroyo-Mora. This is an open-access article distributed under the terms of the Creative Commons Attribution License (CC BY). The use, distribution or reproduction in other forums is permitted, provided the original author(s) and the copyright owner(s) are credited and that the original publication in this journal is cited, in accordance with accepted academic practice. No use, distribution or reproduction is permitted which does not comply with these terms.
*Correspondence: Margaret Kalacska, Margaret.kalacska@mcgill.ca